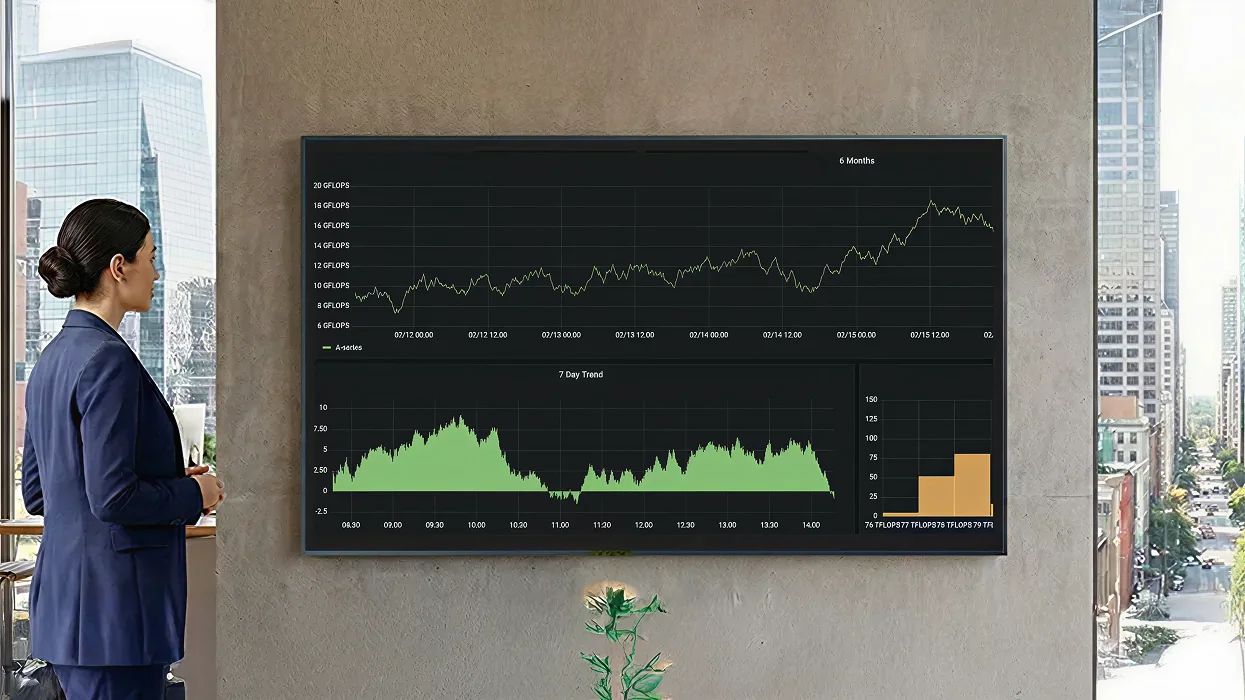
Get Live Grafana on Your Workplace Screens. Zero Hassle
Give NOC and SRE teams a clear, shared view of system health—auto‑refreshing Grafana panels and alerts.

Trusted by 9,000+ Businesses
SSO & MFA
ISO 27001
SOC 2
On-Premise
99.9% Uptime SLA
Pickcel + Grafana: High-Impact Use Cases
NOC wall • Service SLOs • Capacity & latency • Release health
NOC wall
- Faster detection
- Shared situational awareness
Service SLOs
- Lower error-budget burn
- Higher SLO compliance

Release health
- Catch regressions faster
- Enable confident rollbacks
Capacity & latency
- Detect saturation early
- Reduce p95/p99 spikes
Simple Login and Use.
Easy access and effortless day-to-day screen management.
SSO/MFA
No public URLs
Cloud / On-Premise
SOC 2 Type II
ISO 27001 Certified
One console for 10 or 10,000 screens.
Works with Grafana Cloud & self-hosted (OSS/Enterprise)
Auth & network: SSO or API key (per policy); no inbound exposure
Multizone layouts (Grafana + incident ticker + widgets).
Playback & uptime logging (export‑ready for audits).

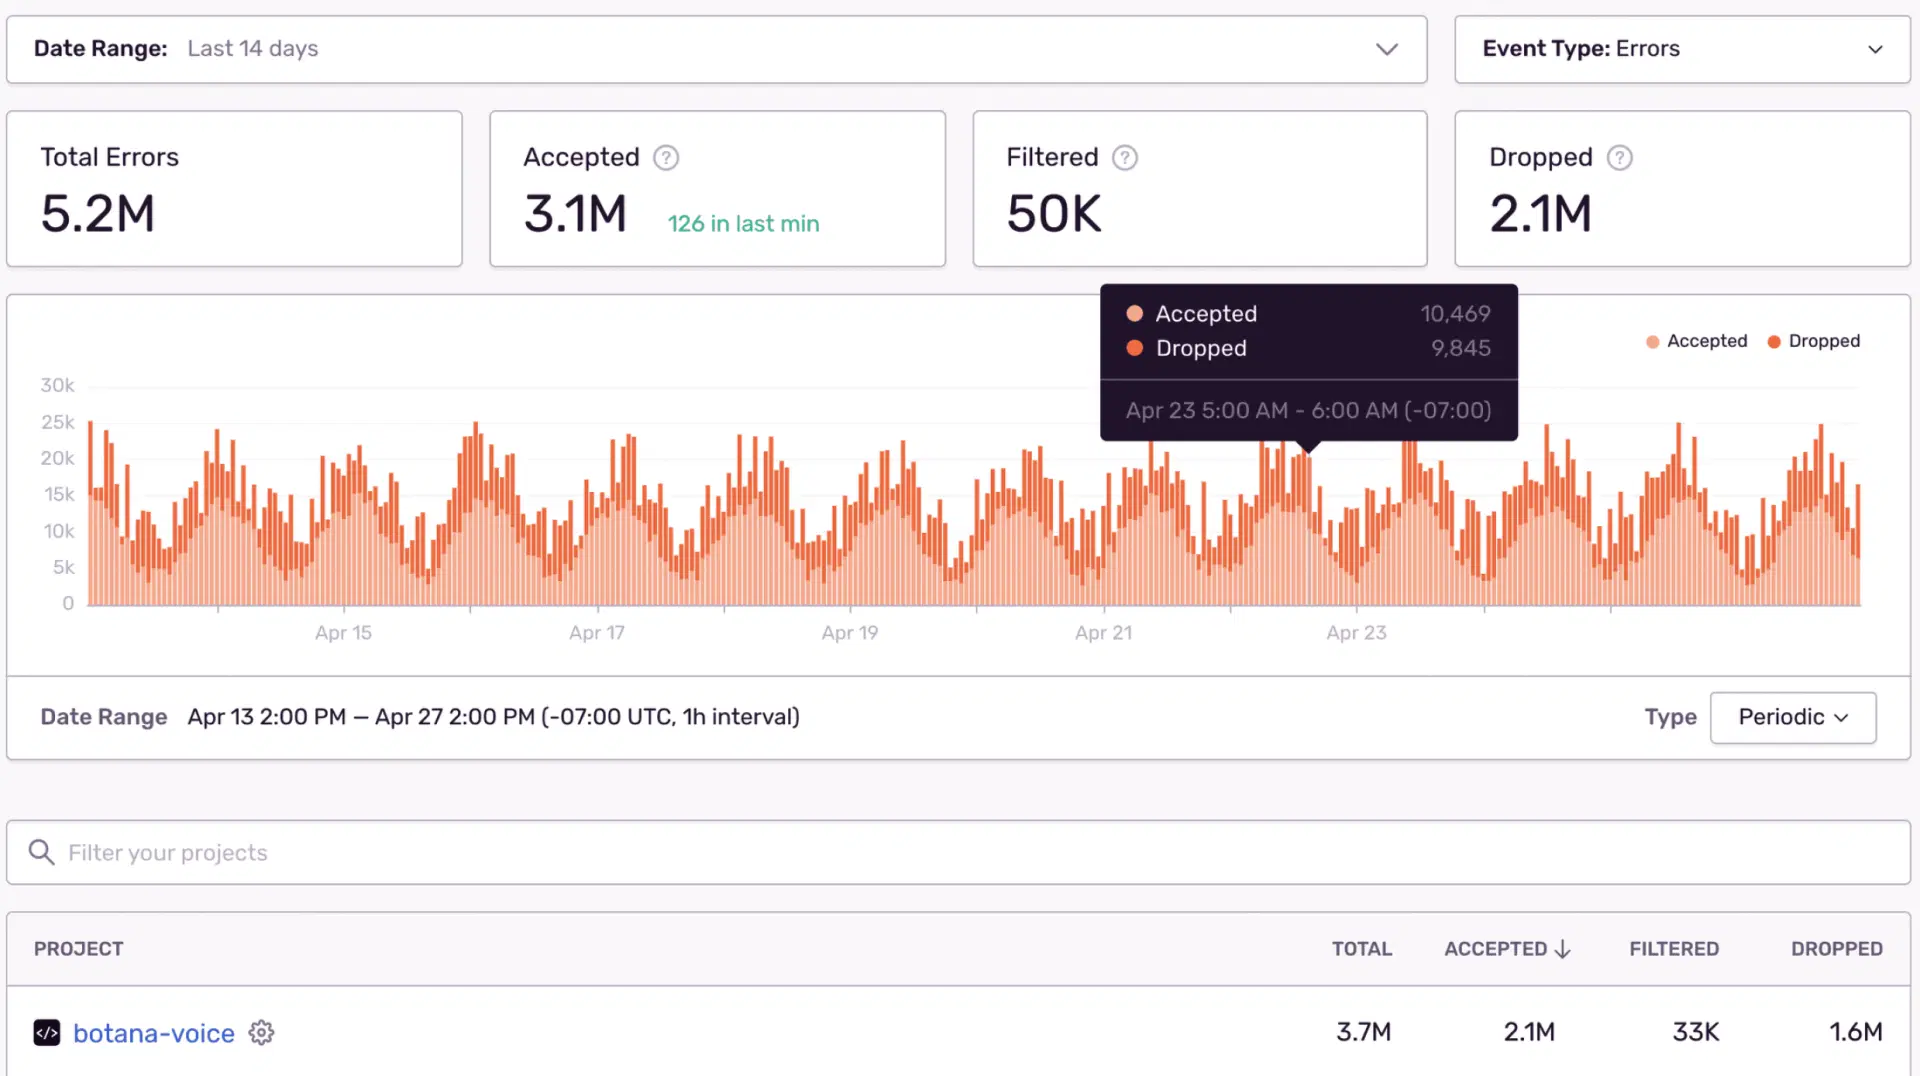
Supporting these dashboard and more
For data outside those tools, Pickcel brings the same secure, always-on delivery to your internal systems.

